Available on All Major Platforms
Download B4 Indicator for free on your preferred trading platform
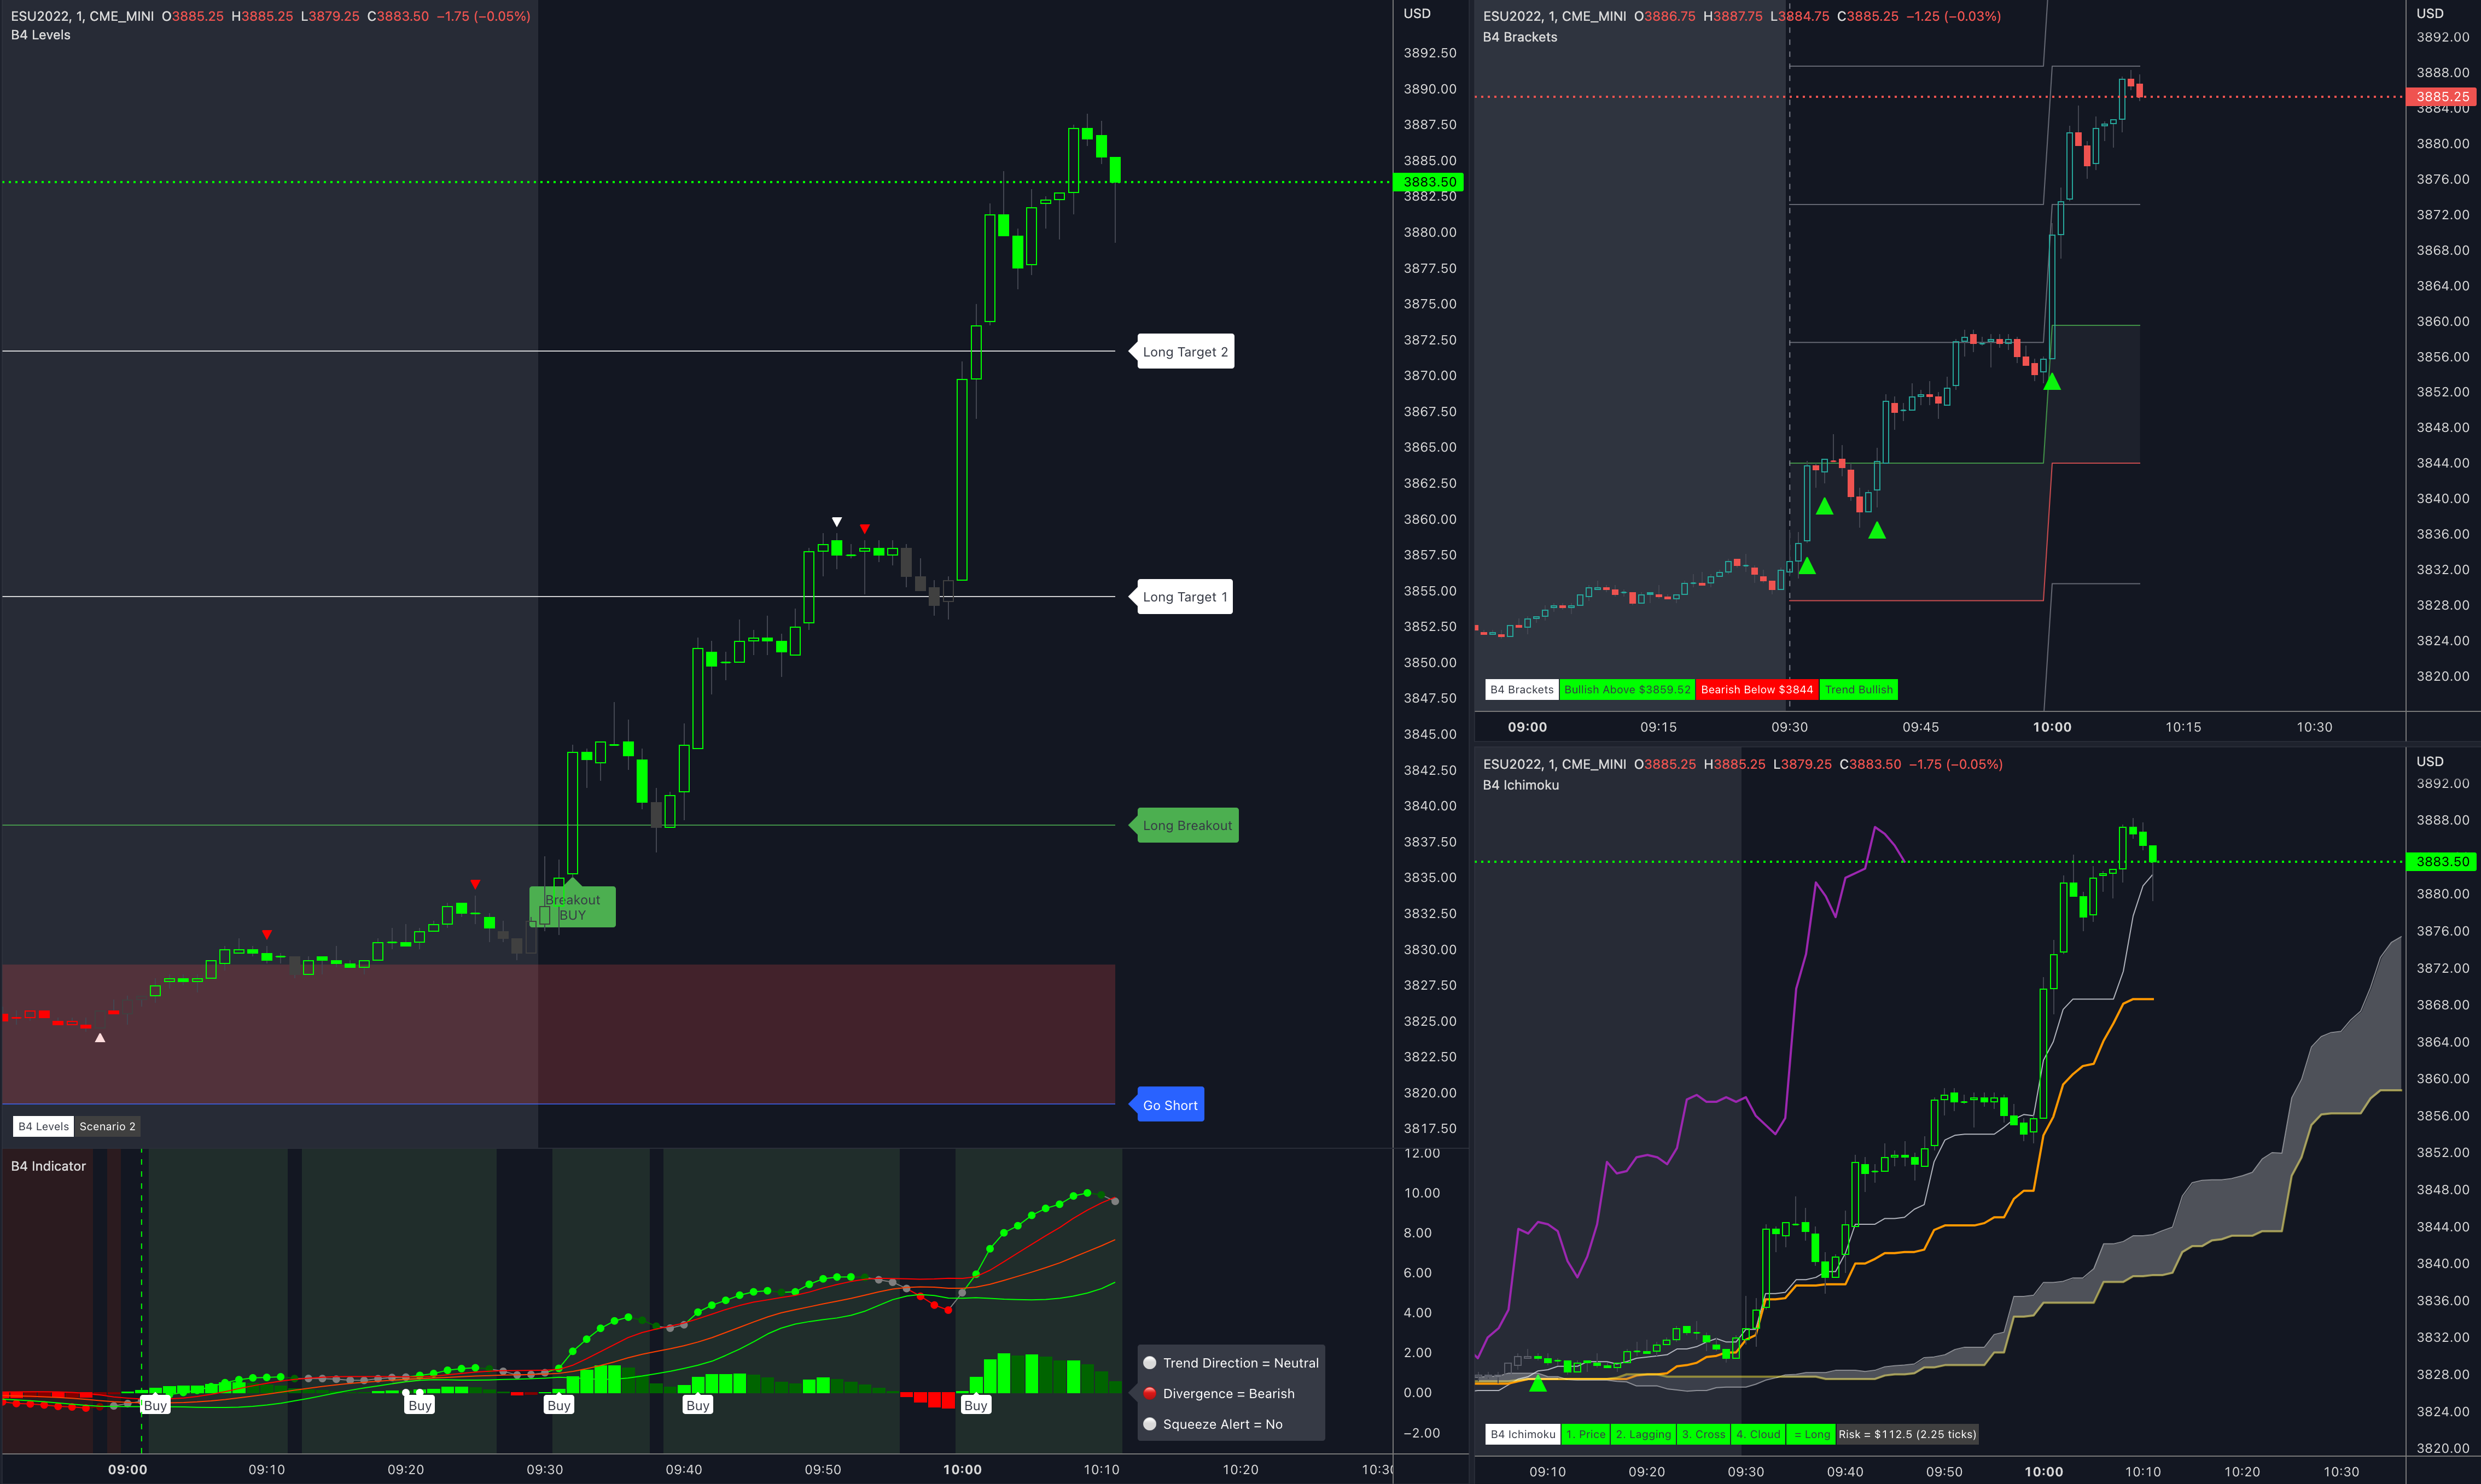
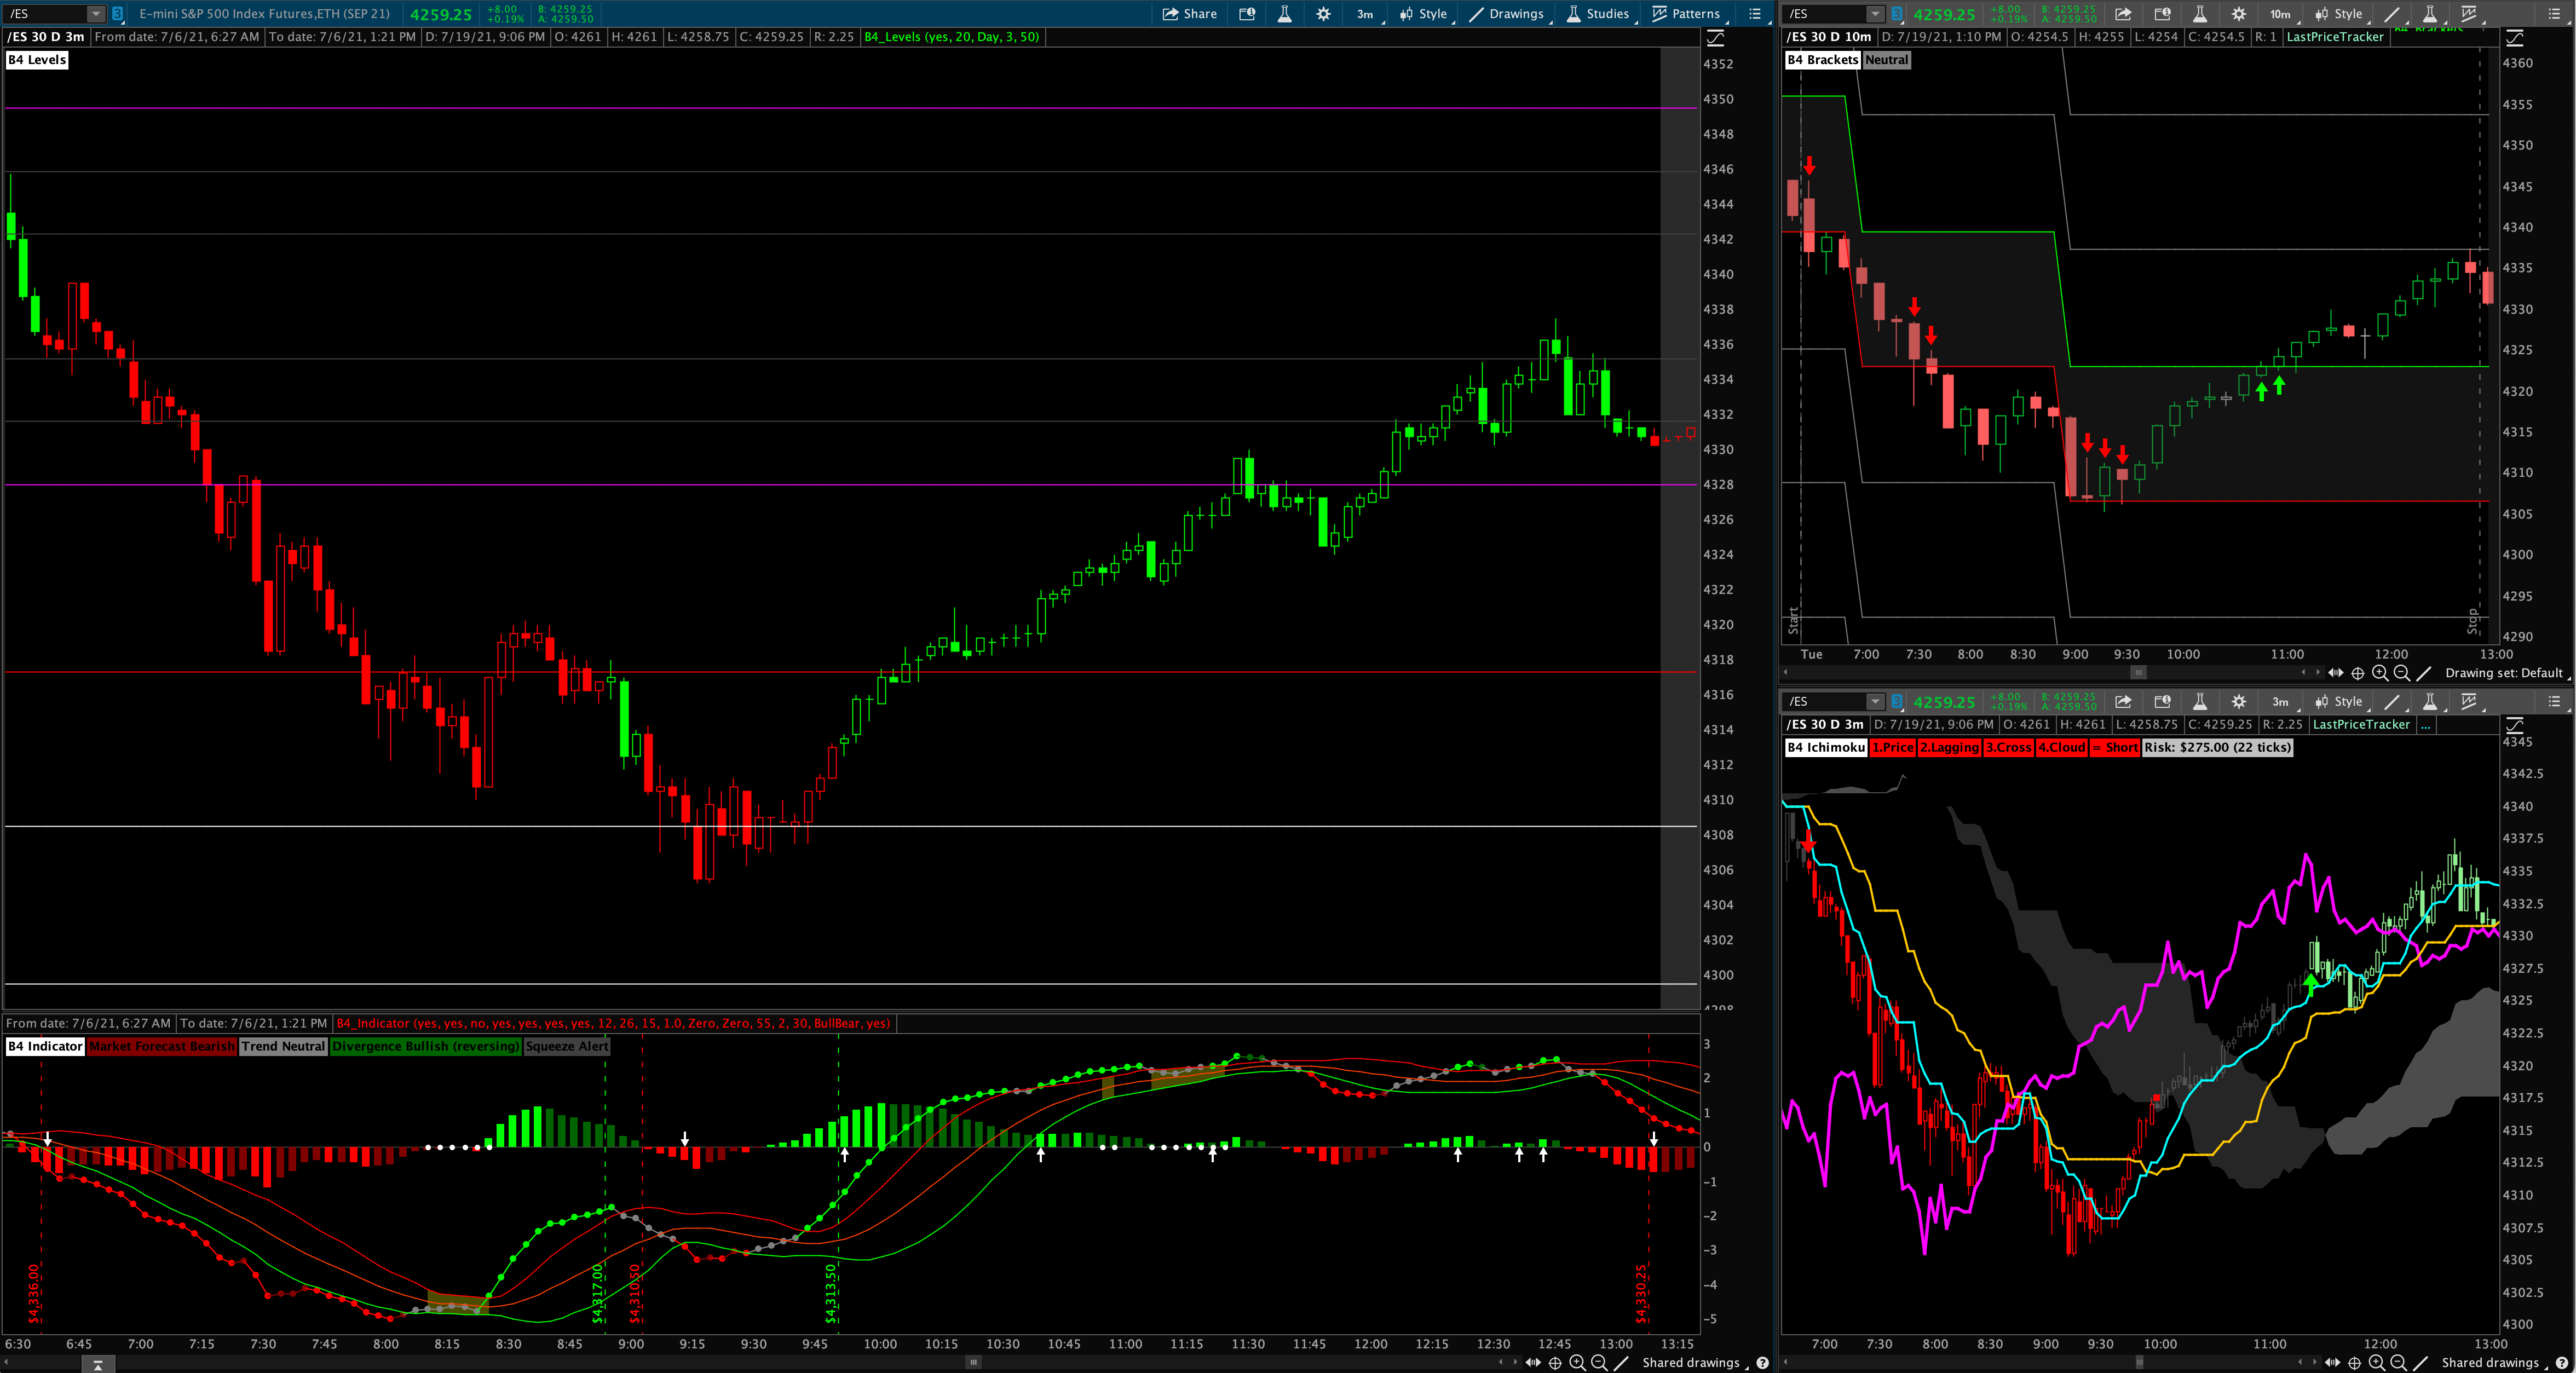
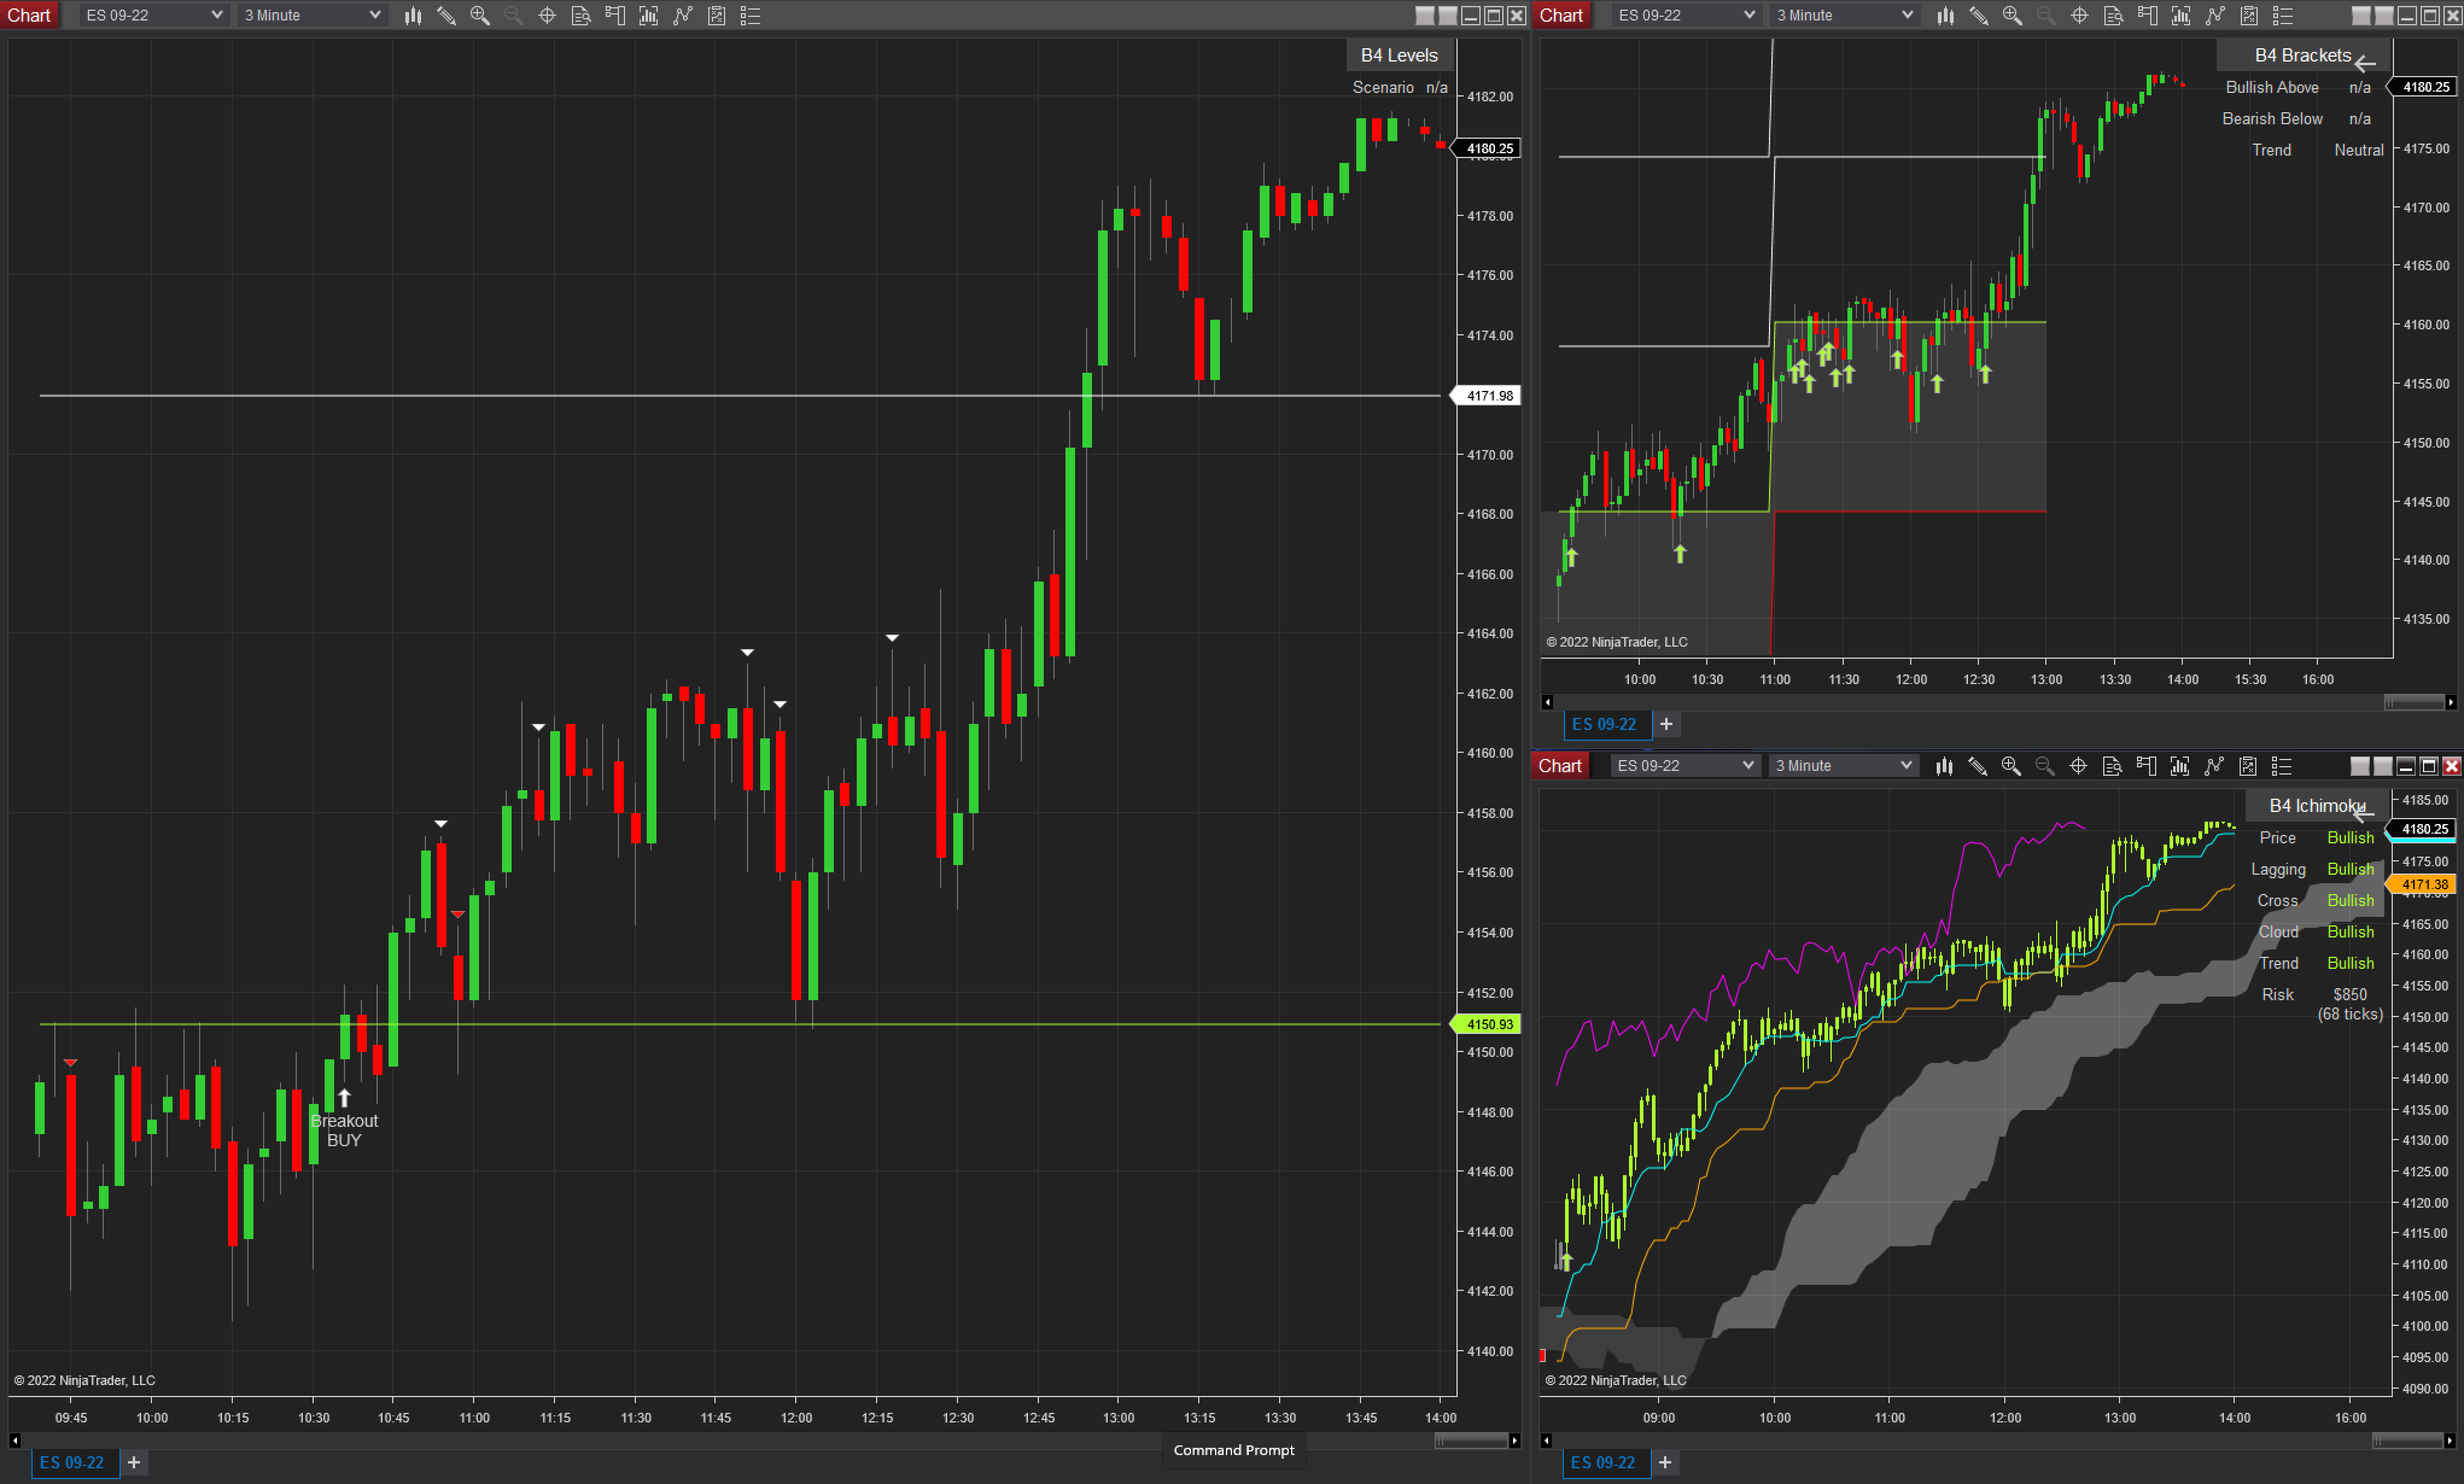
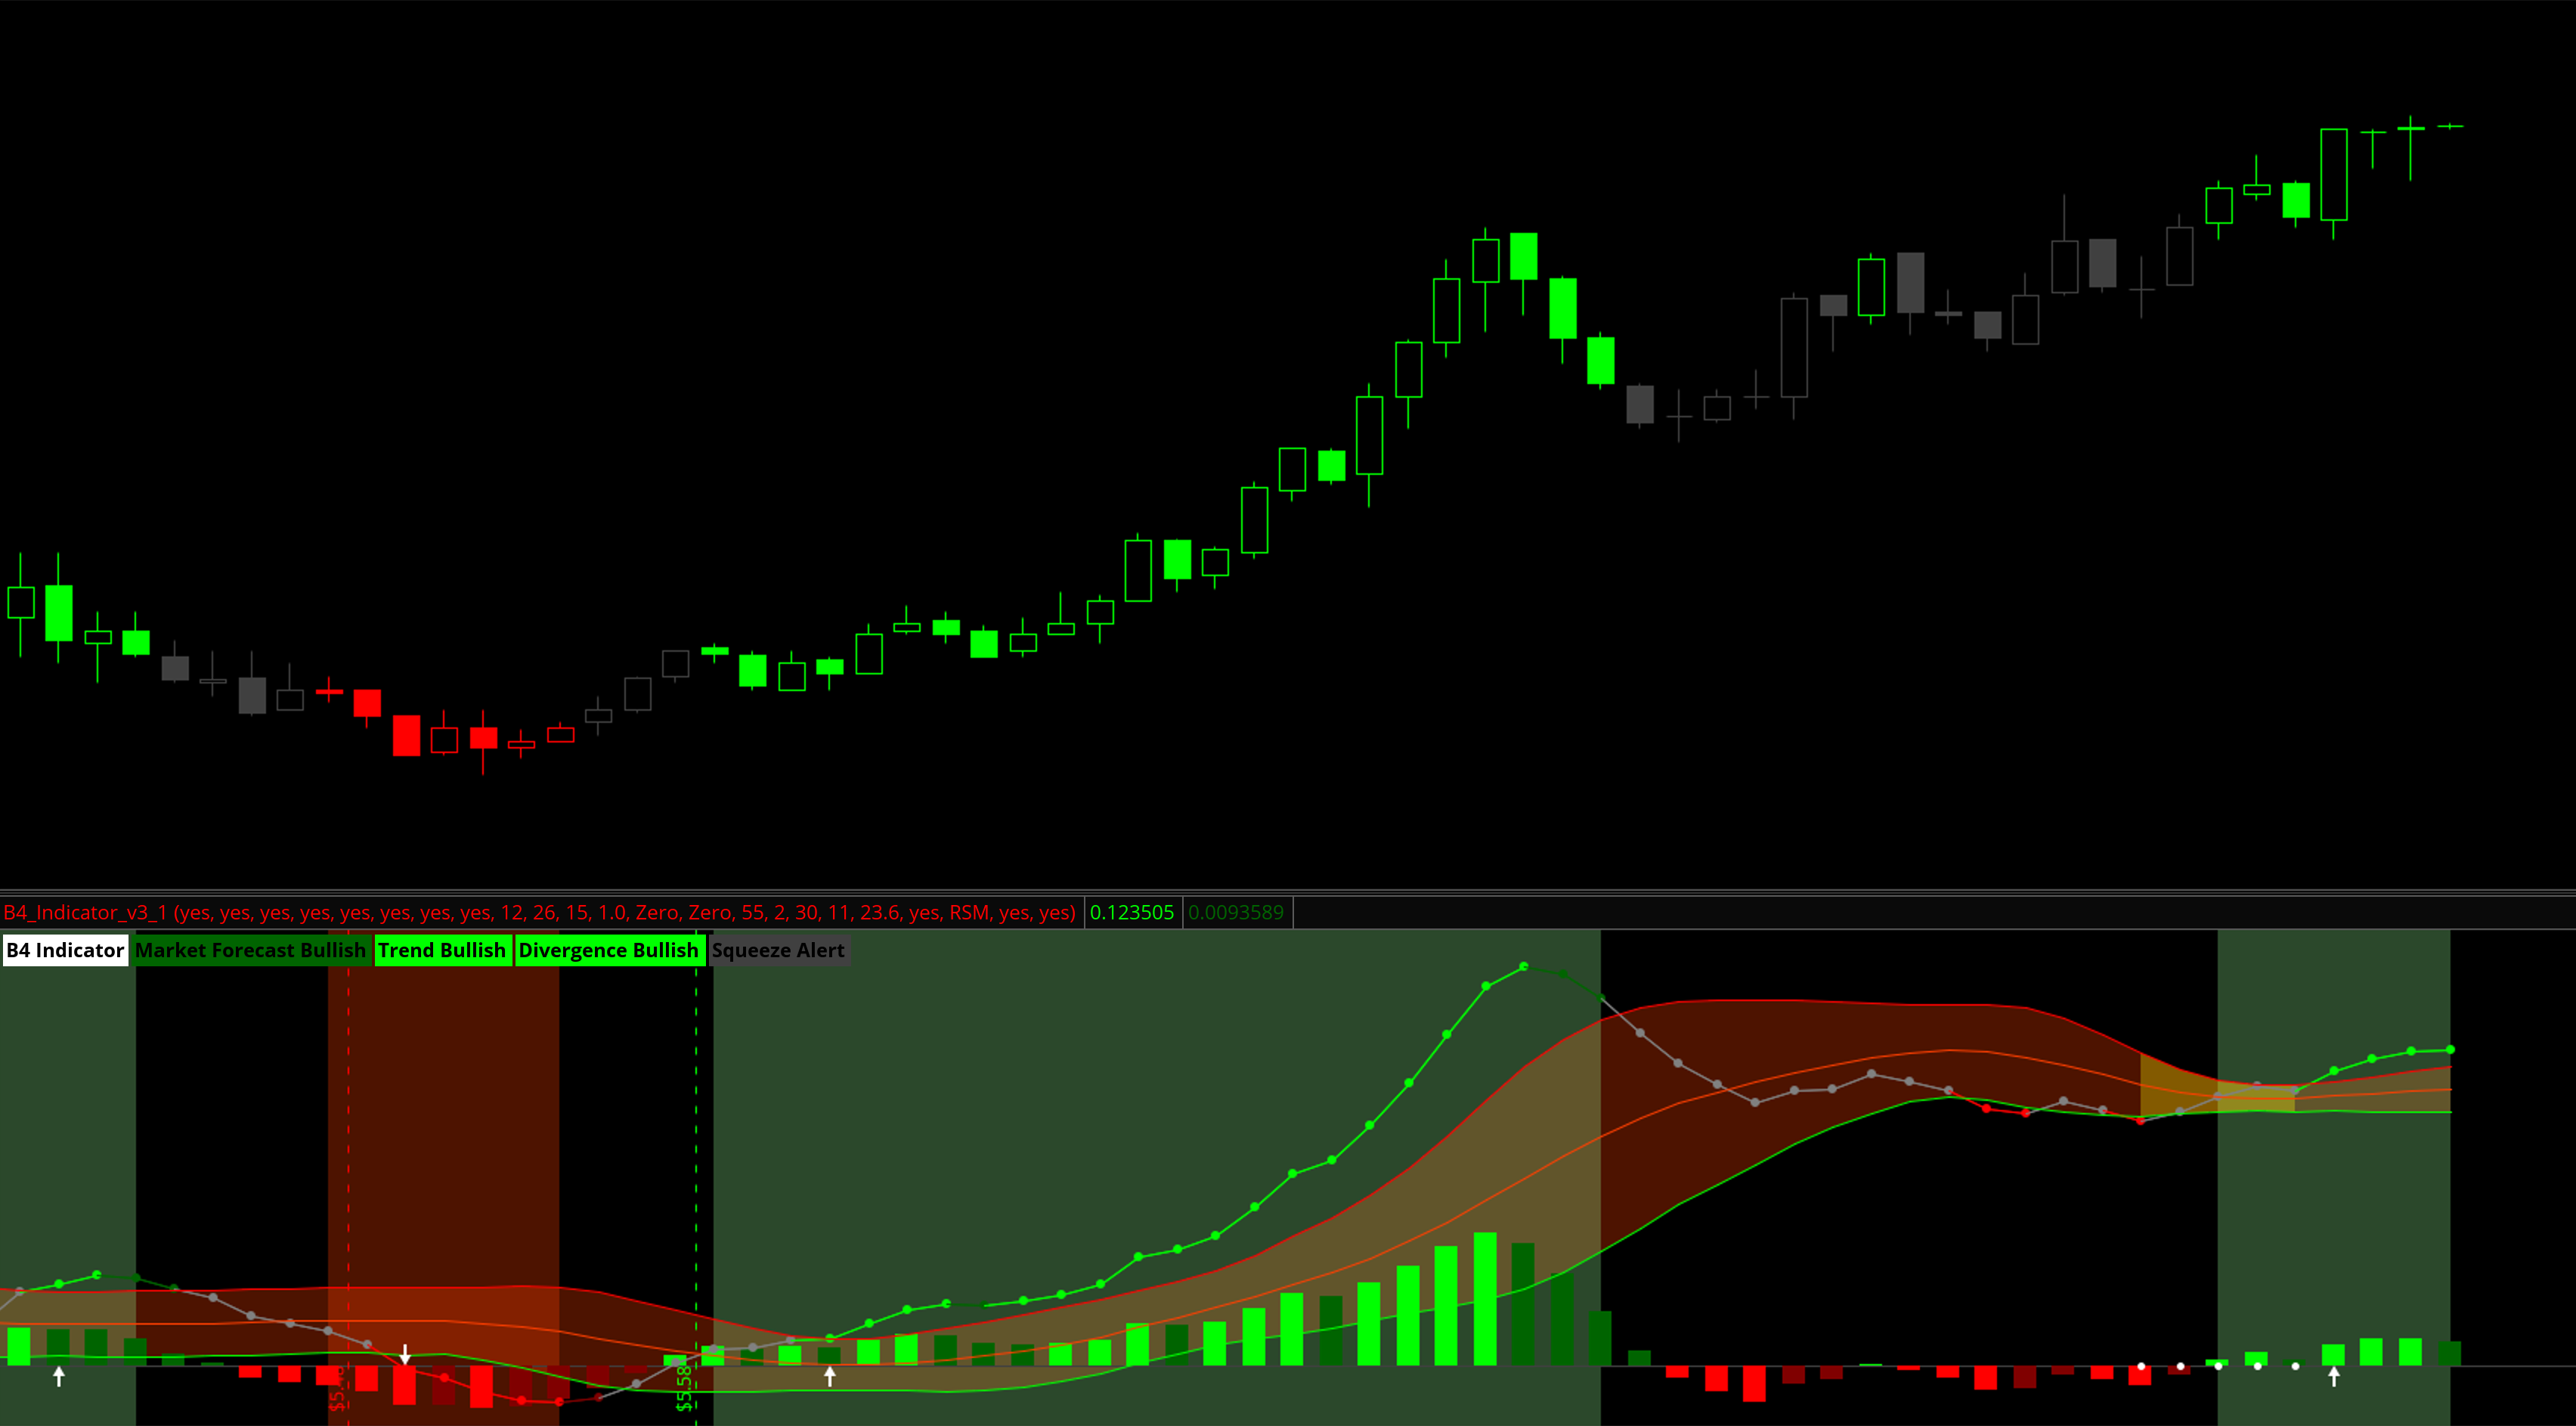
B4 Indicator delivers institutional-grade analysis for TradingView, Thinkorswim, and NinjaTrader. Trend detection, squeeze alerts, and divergence analysis engineered to give you a measurable edge.
Download B4 Indicator for free on your preferred trading platform
Everything you need to identify high-probability trade setups with confidence.
Key strategies for maximizing your trading results
Trade in alignment with B4 midline direction. When trend label and B4 Trend line agree, you have confirmation.
Squeeze dots on zero line signal consolidation. Draw wedge patterns and prepare for breakouts.
Enhance confirmation with divergence analysis between price action and indicator readings.
When B4 Trend Line crosses bands during tight consolidation, expect strong directional moves.
Dark green suggests bearishness, dark red indicates bullish sentiment. Use for pullback detection.
When B4 Trend Line turns gray, wait for midline crossover confirmation before entry or exit.
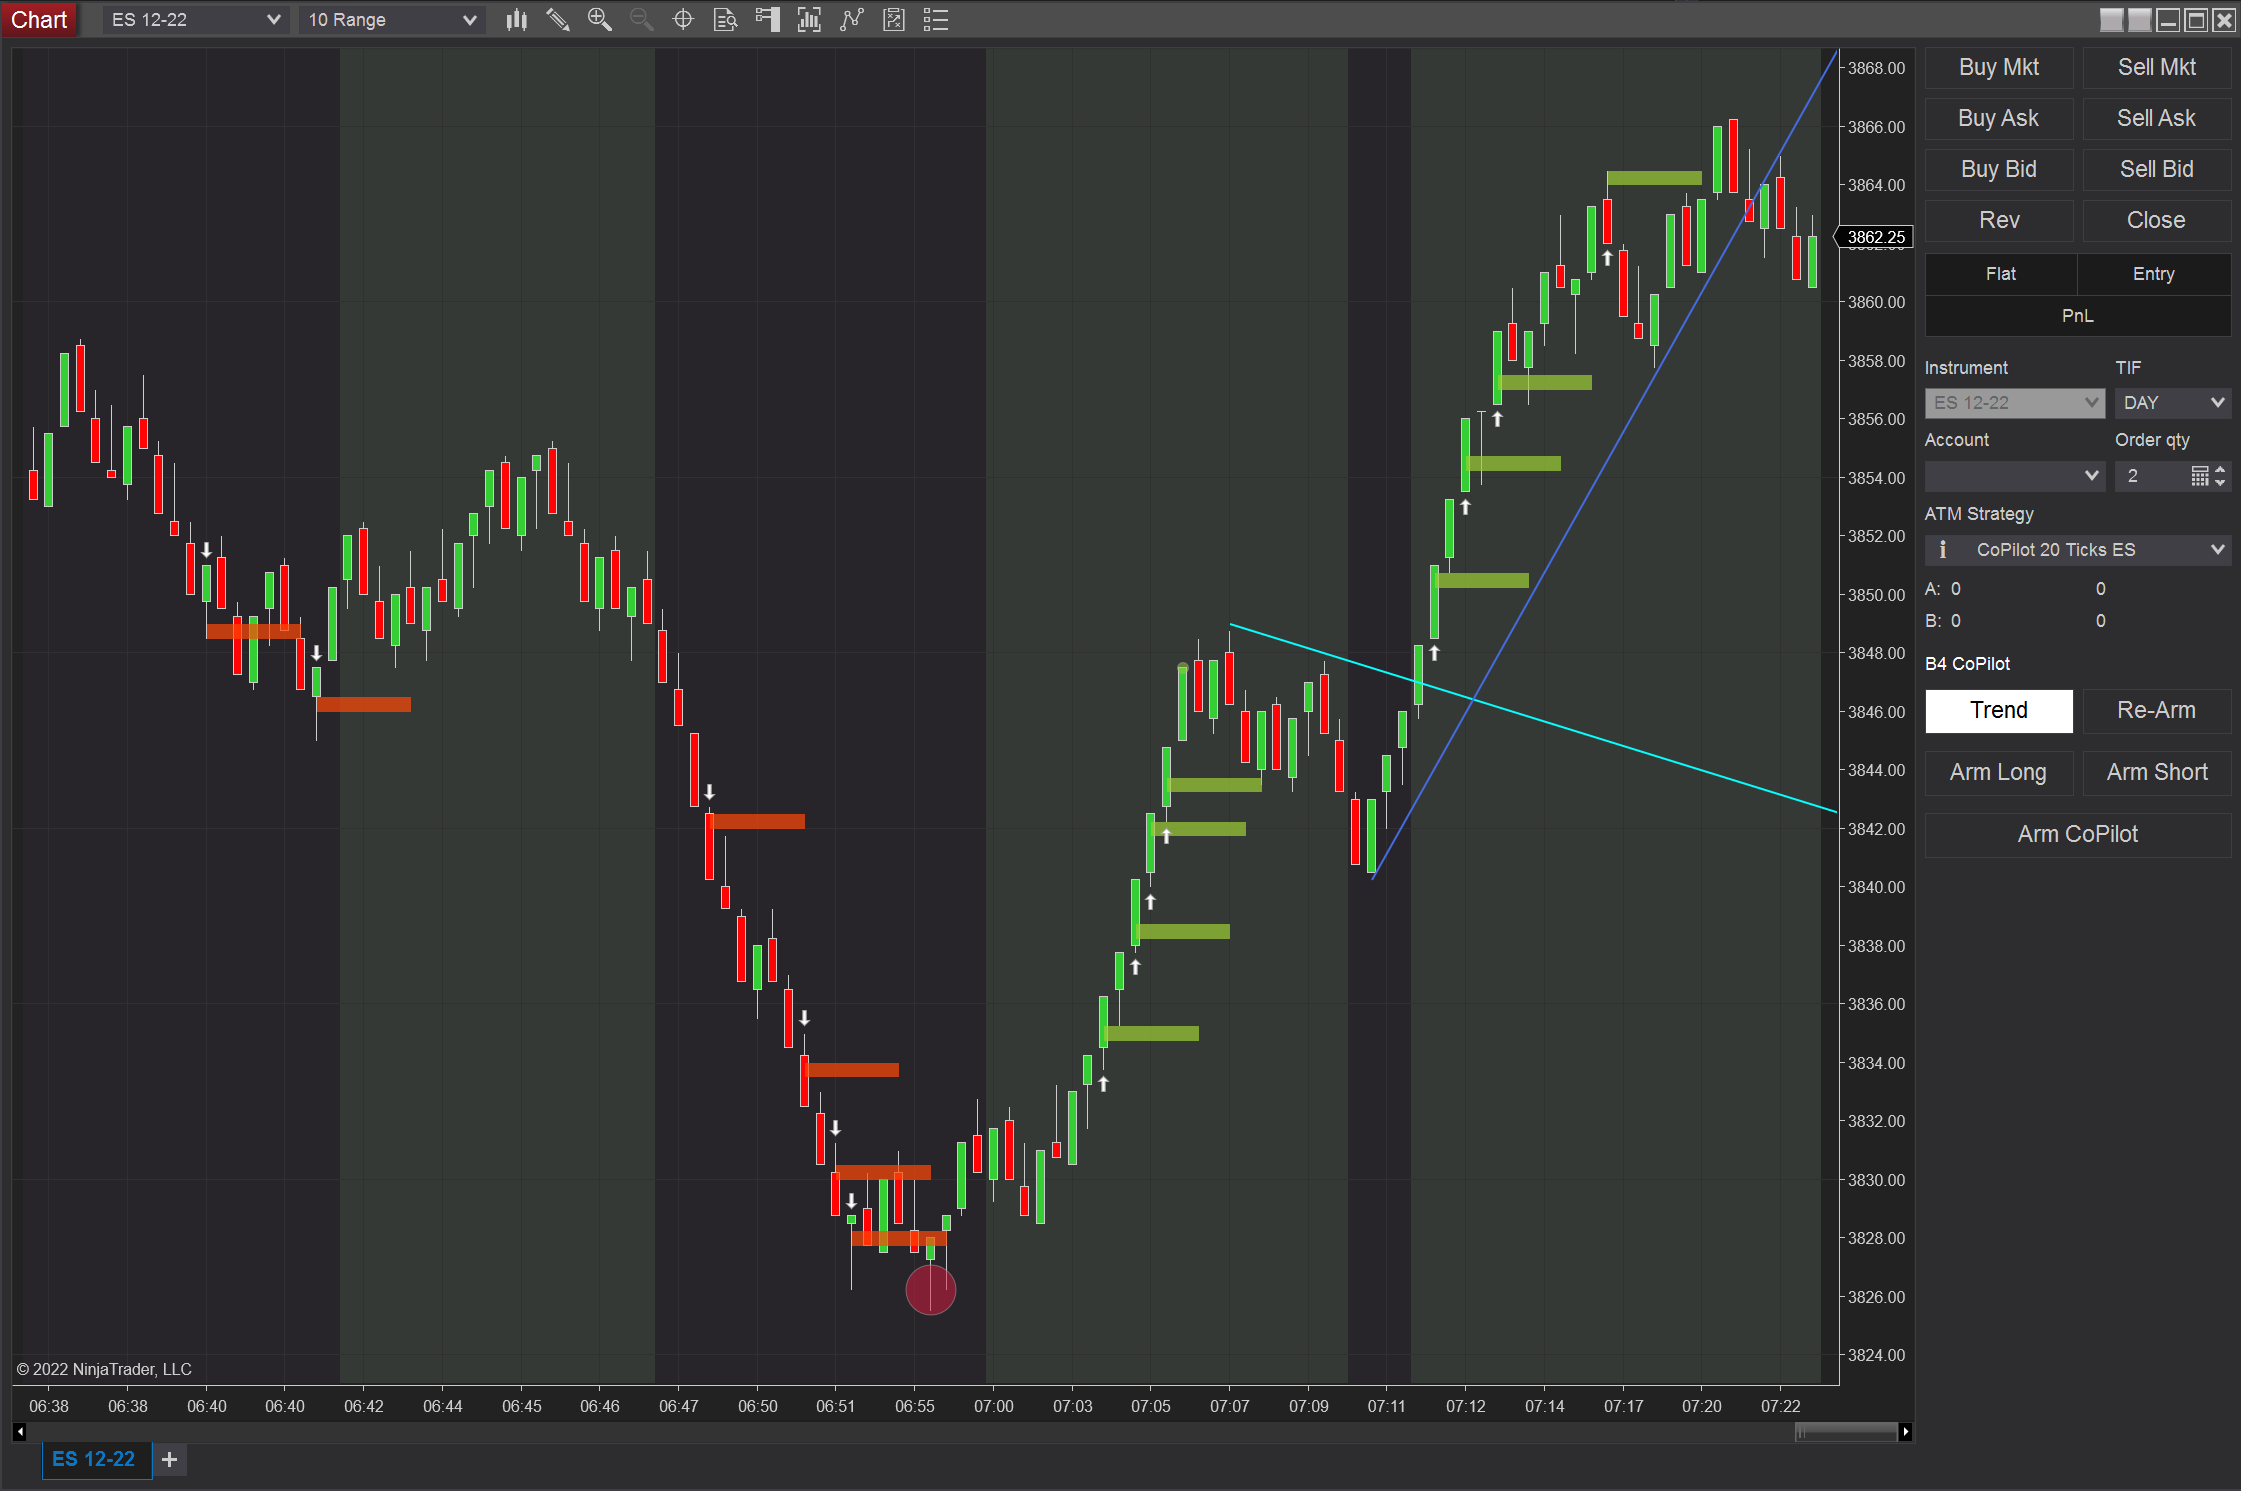
Upgrade to B4 Trading Tools for the complete trading system
A full-featured semi-automated trading companion for NinjaTrader 8. Minimize the hard work of analyzing price action and let CoPilot execute trades with your predefined strategy.
Join our community and unlock exclusive benefits designed to accelerate your trading success.
Join thousands of traders using B4 Indicators to find better entries and exits.